Showing posts with label SAPBI. Show all posts
Tuesday, 20 June 2017
Friday, 3 March 2017
Step by step process for Mobile Configuration in SAP Business Objects
Login into BO Server and follow the step by step configuration process:
- Click start button and open the Central Configuration Manager as shown below:
- Then stop the Apache Tomcat service
- Click Computer in start button
- Open “Program files(x86)”, refer your drive where the Business Objects is installed (We have installed in E drive)
- Open SAP Business Objects folder
- Then open “Mobile 14” folder
- Next open Server folder
- Copy both .war files(MobileBIService.war,MOBIServer.war)
- Open “Tomcat6” folder
- Open “webapps” folder
- Paste the copied .war files in the “webapps” folder
- The following selected folders will be deployed automatically, once the “Apache Tomcat” service in Central Configuration Manager starts
- Open “server.properties” file with notepad in below location:SAP BusinessObjects/Tomcat6/webapps/MOBIServer/WEB-INF (See below), then change DisplayName,MOBILE_USER_NAME, MOBILE_URL, MOBILE_CMS as per your configuration and save.
- Open “mobi.properties” with notepad in below loation: SAP BusinessObjects/Tomcat6/webapps/MobileBIService/WEB-INF (See below)
- In this file change corporate category, personal category as shown in next image and save.
- Open “Control Panel” in Start button and click “uninstall a program” as shown below:
- Select “SAP BusinessObjects BI platform 4.0SP4” and click “Uninstall/Change”
- On "Select Features" page, select the “Mobile Services” ,”Mobile Servers” and “CMS plugin for Mobile” features as shown below.
- Note: ‘CMS plugin for Mobile’ will be enabled by default in the SAP BO setup>Select Features.
- If the options are enabled by default then click “Cancel” button below
-
- Now click “Exit Setup”.
- Now open Cockpit BI URL and select the report you want to see in mobile. Right click on the report and select “Categories” option, as shown below:
- Expand “Corporate Categories” and select “Mobile” option, click “OK” button below. If you don’t want to see the reports in mobile then deselect “Mobile” option in the same window.
- Install the Mobile application “SAP Business Objects Mobile” and click on “Connect” and select “Create New Connection” option
- Enter these details in the screen below to connect BI enterprise
Connection Name: Mobile
Mobile Server URL: http://SERVERIP:8080
CMS Name: SYSTEMNAME:6400
User Name: 123456
Password: *****************
Authentication Type: Enterprise
Click Save
as shown below:
- Click Connect and Select the created connection.
- Enter Application Password to access the mobile app (optional).
Tuesday, 21 June 2016
Web Intelligence Interview Questions
1) How does Web Intelligence work?
Web Intelligence provides business users an easy to use interactive and flexible user interface for building and analyzing reports on corporate data over the web, on secured intranets and extranets. The Web Intelligence software is installed by your administrator on a web server on your corporate network. To use Web Intelligence from you local computer, you log into the business intelligence portal InfoView via your Internet browser. Then, depending on your security profile, you can interact with the reports in corporate documents or edit or build your own documents using a Web Intelligence report panel or query panel.
2) What are different tools used to create or edit Web Intelligence reports?
You can create or edit Web Intelligence documents using one of several tools:
• Java Report Panel
• Query – HTML
• HTML Report Panel
3) How is Web Intelligence Java Report Panel designed?
The Java Report Panel is designed for users who need more flexibility with designing report layout and defining formulas and variables. A graphical Formula Editor enables you to build formulas rapidly using drag-and-drop.
Note: The Web Intelligence Java Report Panel is available if your administrator has deployed Web Intelligence in ASP mode and if your administrator has deployed Web Intelligence in JSP mode.
4) How is Web Intelligence Query- HTML designed?
Designed for users requiring a pure HTML environment to build data providers, Web Intelligence Query – HTML offers the ability to define the data content of documents on multiple data sources. You can use Query – HTML to create new documents from scratch or edit the data providers in documents created using any of the other Web Intelligence tools.
Used together with On-Report Analysis, Query – HTML provides a complete solution for building data providers and designing powerful reports in a pure HTML environment. Once you have run the data providers to generate a standard report, you can leverage Web Intelligence On-Report Analysis features to format multiple reports, add formulas, and create variables.
Note: Web Intelligence Query – HTML and On-Report Analysis in Interactive view format are only available, if your administrator has deployed Web Intelligence in JSP mode.
5) How is Web Intelligence HTML Report Panel?
Designed for users who need to build basic reports, the HTML Report Panel provides query and report features in a simple wizard-like interface. Each document is based on a single data source and can contain multiple reports, displaying different subsets of information. In addition, the HTML Report Panel is 508 compliant and can be customized for specialized deployments.
Note: The Web Intelligence HTML Report Panel is only available, if your administrator has deployed Web Intelligence in JSP mode.
6) What information do you need before logging into Infoview?
Before you can use InfoView and Web Intelligence you need the following information:
• a URL to the InfoView server
• the InfoView server name and port number
• your login and password
• your authentication, which controls the InfoView resources available to you
7) What are the two ways in which data in the Web Intelligence document is edited?
There are two ways to open a Web Intelligence document in edit mode:
• view the document first and then switch to Edit mode
• switch to edit mode directly without viewing the document contents first
8) What are data providers?
A data provider contains one or more queries that return data from a database. A query requests data from the database. If the data is available, then the requested data is returned by default in the form of a table which contains rows and columns. When you build a query, you are creating a request for information from a database. A request can be very simple, for example; give me total sales in California for the first quarter of last year, or more complicated, for example; give me an average age of customers who bought sweaters during the spring television promotion in Paris.
Queries are sent to the databases in a language called SQL (Structured Query Language). However, when you use Web Intelligence you do not have to know any SQL. The Web Intelligence report panel presents the information available in the database as objects that have names and meanings familiar to you. These objects are organized in a structure called a universe.
You build data providers by combining objects in a universe. The universe translates the objects presented in your business language to SQL, and then sends the request for information to the database. Web Intelligence can generate SQL data providers of unlimited length. When the data is returned to the Web Intelligence report panel, it is presented in a table form, with columns that have the same names as the objects that you used in the query. The data is arranged in rows.
9) What is scope of analysis?
The scope of analysis for a query is extra data that you can retrieve from the database to give more details on the data returned by each of the objects in a query. This extra data does not appear in the initial result document, but it remains available in the data cube, so you can pull this data in to the report to allow you to access more detail at any time. This process of refining the data to lower levels of detail is called drilling down on an object.
In the universe, the scope of analysis corresponds to the hierarchical levels below the object selected for a query. For example, a scope of analysis of one level down for the object Year, would include the object Quarter, which appears immediately under Year.
You can set this level when you build a query. It allows objects lower down the hierarchy to be included in the query, without them appearing in the Results Objects pane. The hierarchies in a universe allow you to choose your scope of analysis, and correspondingly the level of drill available.
You can also create a custom scope of analysis by selecting specific dimensions to the Scope of Analysis pane.
Note: You cannot define a scope of analysis when working in Query Drill mode. Query Drill defines the scope automatically in response to drill actions.
10) What is the functionality of cube?
The scope of analysis for a query is extra data that you can retrieve from the database to give more details on the data returned by each of the objects in a query. This extra data does not appear in the initial result document, but it remains available in the data cube, so you can pull this data in to the report to allow you to access more detail at any time. This process of refining the data to lower levels of detail is called drilling down on an object.
When you run the query, the dimensions included in the scope of analysis are returned to the cube for that document, but are not projected onto the reports that the document contains. They can be added to the reports at any time, without having to run the query again. Values for the dimensions in the scope of analysis can also be viewed by switching a report to Drill mode, and then drilling down to them from the values displayed on the report.
11) What is an ambiguous query?
An ambiguous query is a query that contains one or more objects that can potentially return two different types of information. In a universe, certain dimensions may have values that are used for two different purposes in the database. For example, the [Country] dimension in the query below can return two types of information:
• Customers and the country in which they spent their vacation.
• Customers and the country for which they have made their reservation.
The role that Country plays in this query is ambiguous. A country value can be either the country where a vacation was sold, or a country where a vacation is reserved. One is existing information (sales), and the other is future information (reservations). To avoid ambiguities in a query, the universe designer identifies the different ways that objects can be used in the universe, and implements restrictions on how these objects can be combined. These restrictions are called contexts.
12) What is a context?
A context is a defined group of objects that share a common business purpose. This business purpose is usually the type of information that these related objects represent. For example, a sales context is a grouping of all the objects that can be used to create sales data providers. A reservations context is a grouping of all the objects that can be used in reservation data providers. Contexts are defined in a universe by the universe designer.
You can combine any object within the same context to create a query. You can also combine objects in different contexts. If you use an object that is common to both contexts, Web Intelligence will try to determine the context that best fits the other objects in the query.
13) What are incompatible objects?
Sometimes it is not possible to use certain combinations of objects in data providers. This situation arises when objects bear no relationship to one another. These objects are called incompatible objects.
For example, the Island Resorts Marketing universe contains the [Reservation Year] and [Revenue] objects, which are incompatible. This is because there is no revenue associated with a reservation. Revenue is generated only when the customer is invoiced. The underlying database structure reflects this; you cannot build a query that aggregates revenue by reservation year because there is no such thing as revenue by reservation year. In other words, the aggregation context that you specified for the
[Revenue] object does not exist.
When you build a query, Web Intelligence generates SQL behind the scenes. This SQL is run against the database to produce a result that Web Intelligence displays in a report. For a query to be free of incompatible objects, Web Intelligence must be able to generate a single SQL query to retrieve the data. If this is not possible, the query contains incompatible objects.
14) How can queries be combined and what is the use?
You can combine queries in three relationships:
• union
• intersection
• minus
In a union combination, Web Intelligence takes the all the data from both queries, eliminates duplicate rows, and builds a combined data set.
In an intersection combination, Web Intelligence returns the data that is common to both queries.
In a minus combination, Web Intelligence returns the data in the first query that does not appear in the second.
15) What is purging?
When you purge data from a document you remove all data from the document, while leaving the document structure intact. If the document contains multiple data providers, you can purge specific data providers within the document.
16) What are the different table templates used in Web Intelligence?
The different table templates you can use to display information on Web Intelligence reports:
• Vertical tables: Vertical tables display header cells at the top of the table and the
corresponding data in columns.
• Vorizontal tables: Horizontal tables display header cells at the left of the table and the corresponding data in rows.
• Crosstabs: Crosstabs are useful for presenting results that correspond to the intersection of two or more dimensions.
• Forms: Forms are useful in your report if you want to display detailed information per customer, product, or partner. For example, a form is a useful way of
displaying individual customer records with information such as the customer account, name, address, and so on
Types of Reports creation in Crystal Reports
There are four Report Creation Wizards:
• Standard
• Cross-Tab
• Mailing Label
• OLAP
• Standard
• Cross-Tab
• Mailing Label
• OLAP
Standard: The Standard Report Creation Wizard is the most generic of the wizards. It guides you through choosing a data source and linking database tables. It also helps you add fields and specify the grouping, summarization (totals), and sorting criteria you want to use. Finally, the Standard Report Creation Wizard leads you through chart creation and record selection. The Templates screen contains predefined layouts for you to apply to your report to give it more impact.
Cross-Tab: The Cross-Tab Report Creation Wizard guides you through the creation of a report in which your data is displayed as a cross-tab object. Two special screens (Cross-Tab and Grid Style) help you create and format the cross-tab itself.
Mailing Label: The Mailing Labels Report Creation Wizard lets you create a report that is formatted to print on any size mailing label. You can use the Label screen to select a commercial label type, or you can define your own layout of rows and columns for any multi-column style report.
OLAP: The OLAP Report Creation Wizard lets you create a report in which your OLAP data is displayed as a grid object. Although similar to the Cross-Tab Report Creation Wizard in several ways, the OLAP Report Creation Wizard appears to be different due to the requirements of working with OLAP data sources. You first specify the location of your OLAP data, and then you choose the dimensions you want to include in the grid. Next you filter the report data and choose the style of the grid object, which you can also customize. Finally, you can define labels for your grid and insert a chart, if you wish.
Friday, 6 May 2016
Filters in Web Intelligence
Different Types of Filters in Webi. They are as follows
Query Filters: Query
Filters: Single
and Multi-valued Filters
Single ----- Query Filter Condition ------ Equal
To
Single ----- Query Filter Condition ------ Equal
To
Multi
Valued Filters ----- Query Filter Condition ----- LOV’s
Prompted
Filters
------ Dynamic Filters.
This
will ask the user for filter subset, every time the data or the report gets
refreshed. User can enter the prompt either by selecting the values or by
typing. And Prompt can be defined for any object (Dimension, Measure, and
Detail)
Multiple
or Complex Filters:
This
will use more than one filter joined with AND or OR condition or a combination
of both.
Report
Filters:
Global level filters:
Gets applied on the whole report.
Block
level filters: Gets applied on particular blocks.
Advanced Filters: Using
Ranking
Report
Level ----- Analysis ------ Ranking
SAP Business Objects Mobile Server Installation and Deployment
The
SAP Business Objects Mobile solution allows users on the move to access and
analyze business Intelligence data using a mobile device; to help make
analytical decisions. SAP Business Objects Mobile 4.0 Support Package 4
This solution comprises the following three major components:
• SAP Business Objects Mobile Client
• SAP Business Objects Mobile Server
• SAP Business Objects Business Intelligence (BI) platform
Step: 1 Apache
Tomcat Web Application Server
The SAP Business Objects Mobile server
is supported on the Tomcat Web application server. To install
The Mobile server package on the Tomcat
Web application server, perform the following steps:
1. Stop the Tomcat Web application server.
2. Open
the Mobile 14 folder and copy the two .war (MobileBIService.war,MOBI
Server.war)
to the tomcat6/webapps folder
From path: C:\Program Files (x86)\SAP Business
Objects\Mobile 14\Server
Copy
the below files
MobileBIService.war
MOBIServer.war
And
paste it to C:\Program Files (x86)\SAP BusinessObjects\Tomcat6\webapps
The .war files will be automatically deployed
by Tomcat.
3. Start Tomcat
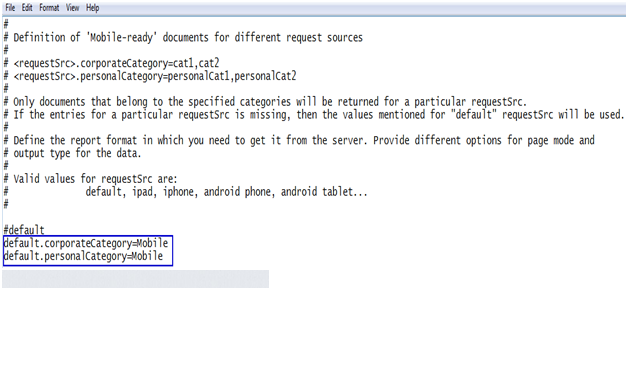
Ø Step 2: Configure the “MOBI.PROPERTIES”
Change bellow path
default.corporateCategory=Mobile,
default.personalCategory=Mobile,
To
default.corporateCategory=Mobile,Category 1, Category 2
default.personalCategory=Mobile,Category 1, Category 2
Ø Step 3: Configuring the
SERVER.PROPERTIES
connection3.DisplayName=Mobile
connection3.BOBJ_MOBILE_USER_NAME= kavya.a
connection3.BOBJ_MOBILE_URL=http://192.168.0.0:8080/BOE/BI
connection3.BOBJ_MOBILE_CMS=lera-1c2a9fa567:6400
connection3.BOBJ_MOBILE_AUTH_METHOD=secEnterprise
Step
4: To verify that the Mobile Server has been
deployed, go to this page to see if it displays the following result status:
SAP BI Mobile Server is now
deployed. It will allow you to access reports through a mobile device using the
SAP Business Objects Mobile app and the SAP Business Objects Explorer
application, once the remaining components are installed and configured as
shown here.
Step: 5 to install the Mobile Plug-in
The
Mobile Plug-in is required by the CMS.
1) In Windows, click Start > Control Panel > Programs and Features > SAP Business Objects BI Platform 4.0 SP4, and then
click Uninstall/Change.
The "SAP Business Objects BI platform 4.0 SP4 setup" wizard opens.
2) On the "Select Features"
page, select the CMS plug-in for Mobile check
box.
Step: 6 to configure
Tomcat to enable the Mobile client
By default, the Mobile will only show reports
that are part of the Mobile category. The Mobile category must
be created manually.
1) In the Central Management
Console (CMC), go to Categories > Manage > New > Category, and type Mobile.
We can now add a report into a category by
going to the CMC > Folders > All Folders > Web Intelligence Samples. Right
click the report and then select Categories. In Categories, select Mobile
Step7: to install SAP Business
Objects Mobile Client
Install the Mobile application in your device and enter the
bellow details to connect BI enterprise
NAME: Mobile BI4.0
Server URL: http://192.168.0.0:8080
CMS Name: lera-1c2a9fa567
Authentication: Enterprise or SAP
User Name: kavya.a
Password: *****************
And connect to Enterprise
Subscribe to:
Comments (Atom)
End-to-End Databricks S3 Workflow: Connect, Create Tables, Archive, and Move Files
End-to-End Databricks S3 Workflow: Connect, Create Tables, Archive, and Move Files Introduction An end-to-end Databricks S3 pipeline ofte...
-
Defragmentation Implementation in ODI: Execute below Code in database to create tables: create table bi11g_dw.defragment_table as select own...
-
Current Date: Syntax: TIMESTAMPADD(SQL_TSI_DAY, 0, CURRENT_DATE) Or Current_Date Current Year: Syntax: YEAR(CURRENT_DATE)...


